
Screen the market in seconds
A stock screener narrows the universe of public companies down to the ones that match a set of criteria you specify. The Screen page accepts more than 170 such criteria — combine any number of them (they're AND-ed together) and tune thresholds inline.
Overview
- Fundamentals, technicals, ownership and news in a single grid
- Multiple views — Snapshot, Valuation, Financials, Performance, Technical, Charts, Heatmap and more
- Instant re-screen as you change filters; saved screens for repeat use
Filters & criteria
Descriptive filters
Exchange
Index
Sector
Industry
Country
Market Cap.
Shares Outstanding = Total Number Of Shares − Shares Held In Treasury
Float = Shares Outstanding − Insider Shares − Above 5% Owners − Rule 144 Shares
Dividend Yield
Option/Short
Analyst Recommendation
Earnings Date
IPO Date
Target Price
Fundamental filters
P/E
EPS = (Net Income − Dividends On Preferred Stock) / Average Outstanding Shares
Forward P/E
PEG
P/S
P/B
Book Value = (Total Assets − Total Liabilities) = Share Holder's Equity
Price/Cash
Price/Free Cash Flow
EPS (ttm)
EPS Growth This Year = (EPS This Year − EPS Previous Year) / EPS Previous Year
EPS growth this fiscal year (GAAP)
EPS growth next fiscal year (GAAP)
EPS growth past 5 years
EPS growth next 5 years
EPS growth qtr over qtr
Sales growth qtr over qtr
Sales growth past 5 years
Dividend Yield (Fiscal Year Estimate)
Return on Assets
Return on Equity
Return on Invested Capital
Current Ratio
Quick Ratio
Long Term Debt/Equity
Debt/Equity
Gross Margin
Operating Margin
Net Profit Margin
Payout Ratio
Insider Ownership
Insider Transactions
Institutional Ownership
Institutional Transactions
Valuation models & yields
EV/EBIT
EV/FCF
Earnings Yield
FCF Yield
P/Tangible Book
Graham Number
Peter Lynch Fair Value
Average P/E (3Y / 5Y / 10Y)
Financial health & quality scores
Altman Z-Score
A = Working Capital / Total Assets · B = Retained Earnings / Total Assets
C = EBIT / Total Assets · D = Market Cap / Total Liabilities · E = Sales / Total Assets
Piotroski F-Score
Interest Coverage
Net Debt/EBITDA
Net Debt/Equity
Net Debt/FCF
Net Cash %
Return on Capital Employed (ROCE)
FCF Margin
Shareholder returns & forward growth
Shareholder Yield
Buyback Yield
Debt Paydown Yield
FCF Growth (5Y)
EBITDA Growth (5Y)
Forward Revenue Growth
Forward EBITDA Growth
Target Price Upside
Number of Analysts
Technical filters
Performance
Performance 1 Month = Last 21 trading days
Performance 3 Months = Last 63 trading days
Performance 6 Months = Last 126 trading days
Performance 1 Year = Last 252 trading days
Performance 3 Years = Last 756 trading days
Performance 5 Years = Last 1,260 trading days
Performance 10 Years = Last 2,520 trading days
Volatility
RSI (14)
Gap
Simple Moving Average
Change
Change from Open
High/Low
Pattern
Candlestick
Beta (5 Years)
ATR
Short Float
Average Volume
Relative Volume
Current Volume
Price
Other data
Shares Outstanding
Shares Float
Saved screens
Sharing a screen
Views & columns
- Snapshot — one-line summary, the default.
- Financials — quarterly EPS, revenue, margins.
- Performance — returns over 1D/1W/1M/3M/YTD/1Y.
- Custom — pick exactly the columns you want. Saved per screen.
Data sources
Screen signals (event lists)
Top Gainers — Largest percent gainers since yesterday's close. (Top 200)
Top Losers — Largest percent losers since yesterday's close. (Top 200)
New High — Stocks that printed a fresh 52-week high today. (Top 200)
New Low — Stocks that printed a fresh 52-week low today. (Top 200)
Most Volatile — Widest intraday high-low ranges today, scaled by price. (Top 200)
Most Active — Highest absolute trading volume today. (Top 200)
Unusual Volume — Largest gap between today's volume and the 3-month daily average. (Top 200)
Overbought — Names whose 14-day RSI is currently above 70 — a setup that often precedes a pause. (Top 200)
Oversold — Names whose 14-day RSI is currently below 30 — a setup that often precedes a bounce. (Top 100)
Downgrades — Tickers with at least one analyst downgrade today.
Upgrades — Tickers with at least one analyst upgrade today.
Earnings Before — Companies scheduled to report earnings today before the open.
Earnings After — Companies scheduled to report earnings today after the close.
Major News — Tickers with the most fresh news items today — useful for stalking event-driven moves. (Top 40)
Chart Patterns — Stocks whose current bars sit at or near a recognized chart pattern. (Top 100, ranked by pattern strength)
Technical Analysis
Technical analysis reads the historical record of price and volume itself — trends, patterns and momentum — without modelling the underlying business or its fundamentals.
Whereas fundamental analysis values a company by looking at its earnings, balance sheet and competitive position, technical analysis works one level removed. It asks a narrower question: given the way price has behaved so far, what is it likely to do next? The answer comes from the chart itself rather than from financial statements.
Two broad toolkits do most of the work. Chart-pattern recognition looks for repeated geometric shapes that price traces over time — wedges, channels, head-and-shoulders, double tops and the like — and trades the moments when those shapes resolve. Statistical indicators reduce price and volume to a single derived series (moving averages, oscillators, momentum gauges) and trade the crossovers, divergences and extremes those series produce.
Both toolkits rest on the same three premises, spelled out below.
The three premises
1. Prices move in trends
2. Price discounts everything
3. History repeats itself
Caveats
Technical analysis is interpretive. Two careful analysts can look at the same chart and read it differently — most indicators have tunable parameters, multiple oscillators can disagree with each other, and every pattern admits exceptions. None of the tools listed in this section produce mechanical buy-or-sell answers; they produce conditional signals that have to be combined with context and risk management.
A related critique is that widespread use of certain technical signals creates a degree of self-fulfilling behaviour: enough participants watching the same 200-day moving average will, between them, defend or breach it more decisively than the underlying setup would predict in isolation. That dynamic cuts both ways — it makes the signals louder, but also more prone to crowded false breaks.
QT Tools
QuoTrend ships a handful of proprietary tools that turn raw market data into decisions: a composite score per stock, a set of curated screens, a what-if simulator for economic releases, and a diagnostic X-ray for any portfolio.
QT Score
- Momentum — relative strength: how the stock's price performance ranks against the whole market across recent windows. The largest driver of the score.
- Growth — historical and forecast growth of earnings and revenue.
- Quality — profitability, balance-sheet health, capital efficiency.
- Valuation — how cheaply the stock trades against its fundamentals.
How to read it
- Leader — the top 10% of scores. Among the market's strongest performers, with supporting fundamentals.
- Strong — above-median (50th–90th percentile). Solid relative strength; check which sub-score leads.
- Steady — below-median (10th–50th percentile). Mixed — strong on one factor, soft on another.
- Laggard — the bottom 10%. Weakest on price and the supporting factors; often beaten-down or out-of-favor names.
Where it appears
Signals
The four families
- Catalyst — a corporate event: an earnings beat or miss, insider buying or selling, an analyst change.
- Price-action — a chart or candlestick pattern: a gap, a channel, a wedge, a reversal.
- Rating — a move in the QT Score, an analyst upgrade, or a bullish drift in the overall sell-side consensus (analysts collectively turning more positive over the past month).
- Sentiment — positioning and crowd mood, such as a short-squeeze setup.
What each signal shows
- Direction — bullish (historically followed by gains) or bearish (historically followed by declines). We show both.
- The “why” — a one-line explanation of what triggered it.
- Magnitude — where past cases of this exact signal landed over the next 20 trading days, shown as the full distribution of outcomes with the sample size, the median, and how often it was positive. It's a historical distribution, never a forecast of this stock.
- QT Score — the quality stamp on the company behind the signal (see QT Score above).
Promoted vs informational
Track record
Free vs Premium
Signal alerts
QT Strategies
- QT Momentum — stocks in healthy uptrends with positive momentum across multiple periods, without being overbought.
- QT Value — names trading at undemanding multiples (P/E, P/B, EV/EBITDA) while still showing solid fundamentals.
- QT Dividend Safe — steady dividend payers with sustainable payout ratios, consistent growth, and durable cash flows.
- Double-Buy — stocks getting two bullish signals at once: insiders buying while analysts upgrade, with fresh news coverage.
- QT Turnaround — beaten-down names showing early signs of reversal — oversold technicals against improving fundamentals.
- QT Compounder — high-quality, long-term growers with strong returns on capital and safely-leveraged balance sheets.
How to use them
How the risk rating is measured
- How it is measured — we re-run each strategy's rules at the end of every month using only information that was public on that date, hold the stocks that pass in equal weight for a month, and chain the results into a continuous track record going back as far as 2006. Delisted companies are included, so a strategy is judged on the names that collapsed as well as the ones that survived.
- What the tiers mean — we compare two figures against the S&P 500 over the same months: how much the basket bounced around, and its worst peak-to-trough fall. Low needs both to be within 1.15× the index; High means either reached 1.5× or more; Mid is in between.
- Why most strategies are not Low — the S&P 500 spreads your money across 500 companies, while a screen hands you a short list. We tested this directly: a basket of randomly chosen stocks moved about 1.3× as much as the index whether it held 6 stocks or 90. A short list is simply bouncier than a whole index. For QT Momentum, QT Value and QT Dividend Safe that accounts for nearly all of the movement; for Double-Buy, QT Turnaround and QT Compounder, a substantial part comes from what the screen actually selects.
- When we show nothing — a strategy with fewer than 36 months of history, or a basket that typically holds fewer than 5 stocks, gets no rating at all, since it would describe those few stocks rather than the strategy. Where a rule cannot be rebuilt from data we do not retain far enough back, it is left out of the measurement — QT Compounder's borrowing limit is one such rule, and applying a stricter stand-in for it leaves its rating unchanged.
Impact Simulator
How to read a scatter panel
- X-axis (-3σ to +3σ) — how much the actual release surprised vs. the consensus expected value, measured in standard deviations. 0σ = the print matched expectations. +1σ = the print came in one standard deviation hotter than expected. -1σ = one standard deviation cooler.
- Y-axis (%) — the instrument's percent price change over the chosen window (1 hour, 1 day, or 1 week post-release).
- Each dot — one historical release event. Its X position is that release's surprise magnitude; its Y position is how the instrument actually moved.
- The colored line — summarizes “on average, what reaction does this instrument show per σ of surprise?”
- The highlighted point — sits on the colored line at your slider's σ value. It's the model's predicted reaction if the next release prints at that surprise level.
- N RELEASES — the sample size feeding the fit. Small samples (n < 20) make the line sensitive to outliers; treat the prediction as illustrative, not authoritative.
Reading the example: SPY at +1σ for an inflation print
Controls — and what they're actually for
- σ slider — sets your hypothetical surprise. The thumb's position is rendered in the slider header both as the implied Actual value (in the release's native units) and as the equivalent σ offset from Expected. Drag to explore different what-ifs; charts and footer pills update as you drag.
- Window selector (1 Hour / 1 Day / 1 Week) — picks which post-release reaction window the scatter and the estimates use. Knee-jerk reactions in the first hour can look very different from where the dust settles a week later, so flip between them to see how persistent the move was historically.
Where to find it
Portfolio X-Ray
Concentration Risk
Factor Exposure
Asset Mix
Risk Profile
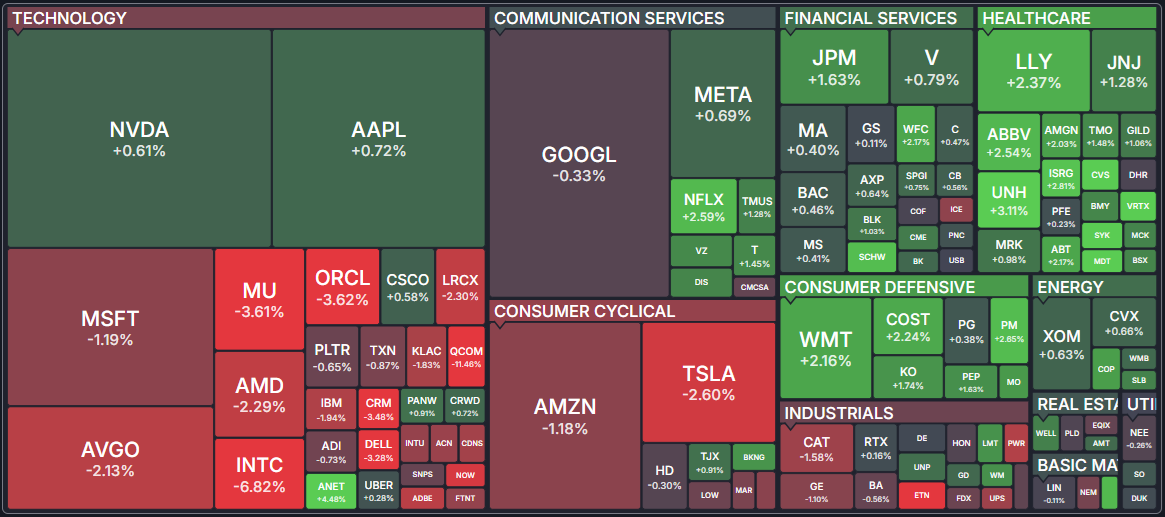
Stock market, at a glance
Market maps visualize thousands of tickers at once. Rectangle size = market cap; color = performance. Hover for ticker detail.
What is a heatmap?
Map types
Color scale
Data types
See where capital is flowing
The Sectors page rolls up market data by sector, industry, country or cap tier. Each row is the combined activity of every ticker that matches — useful for spotting rotation without drilling into individual names.
Overview
Slicing dimensions
Views
- Overview — Market Cap, P/E, Forward P/E, PEG, P/S, P/B, Dividend Yield, Analyst Recommendation, Volume, Change, and number of stocks.
- Valuation — P/E, Forward P/E, PEG, P/S, P/B, Price/Cash, Price/FCF, and EPS/Sales growth rates.
- Performance — Weekly, monthly, quarterly, semi-annual, annual, and YTD performance plus volume metrics.
- Financial — Dividend Yield, ROA, ROE, ROI, liquidity ratios, debt ratios, and margin metrics.
- Custom — Select any combination of columns to create your own view.
- Performance Chart — Horizontal bar charts comparing categories across 7 time periods.
- Charts — Line charts showing 1-year performance for each category with SMA 50 overlay and volume.
- Heatmap — Treemap showing categories as tiles sized by market cap and colored by the selected metric.
How rollups work
Frequently asked questions
Pick a topic on the left, or search above. If you don't find an answer, the contact panel below routes straight to a human.